

Standard deviation (SD) is an often used term among precision shooters and reloaders, but most people who use it don’t have a true understanding of what it means. If understood and used correctly, it can be used to estimate what the ammunition velocity extreme spread (ES) value will be and even contribute to our odds of hitting a target.
What Is It?
To start, SD is not a term unique to reloading. It is actually a statistical principal that gives the confidence level of an assumption.
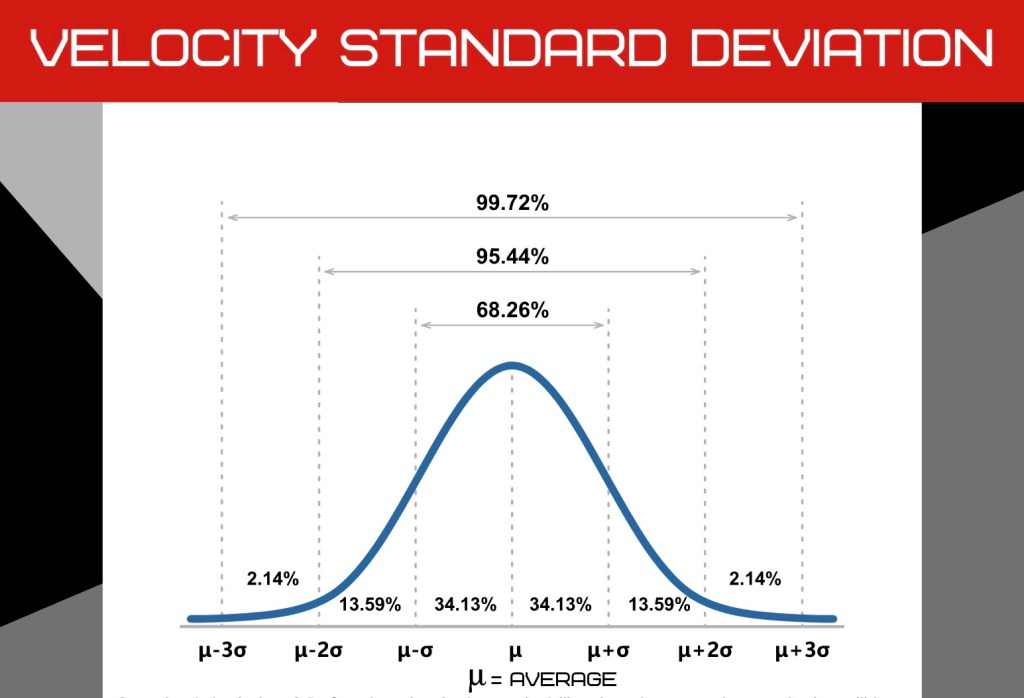
It all starts with a collected data set, such as muzzle velocity, over a large number of shots. Through the shot string, you will have a maximum, minimum, and average. With a large number of shots, you will see that the majority of the shots will be close to the average with less being towards the max and min. You will also most likely have many that are the same velocity. So if you graph the frequency of each velocity you end up with a graph that looks like the image above. Higher reoccurrence near the average at the center of the graph and less near the extremes, giving what is known as a “Bell Curve”.
Because the shot velocities follow this pattern, we get to a point where we can essentially predict the velocity of a shot with different levels of confidence. there is a 68% chance that a velocity will be in the range of the average +- 1 SD. that jumps to about 95% for 2 SD’s and 99% for three SD’s. Lets look at the equation and some examples though to help it make more sense.

Here is the equation to calculate the SD, now lets use that for an example
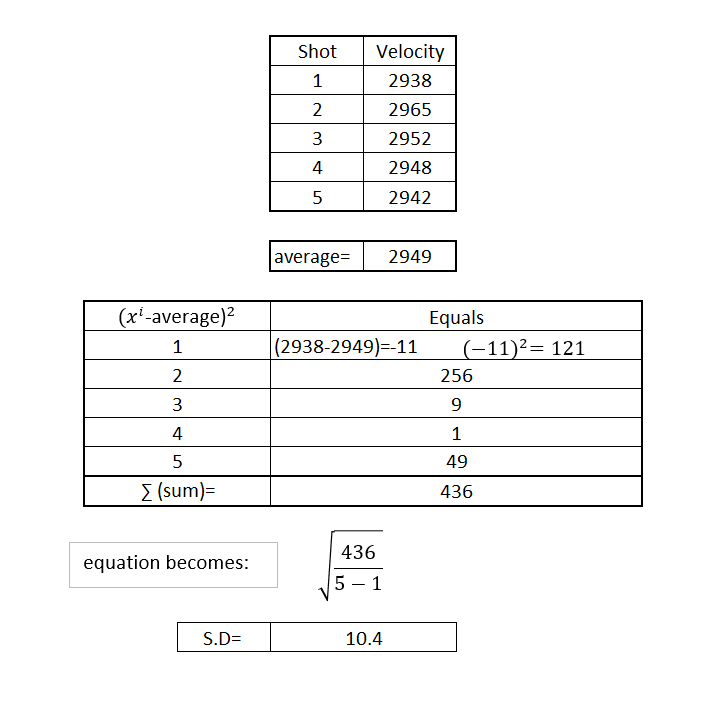
In the example above, the average velocity of the shot string is 2949, an our SD is 10.4. This means that when we take our next shot, we have a 68% of it being between 2938.6 and 2959.4. Our confidence goes to over 99% that the velocity is between 2917.8 and 2980.2. This is why a small SD is important. In the case above, 3 SD’s give our ammunition a potential velocity extreme spread of over 63 feet per second.
This is the main reason i prefer standard deviation to extreme spread. ES only tells you what the max variation is for the bullets you have shot so far. SD can be used to predict what the true ES is, as well as how consistent the ammunition can be.
The important part though is that it needs to be applied correctly. A shot string of 3 shots won’t give us enough data to accurately predict a trend. I use five shots minimum when I’m doing load development, but verify all my final loads with at least 15 rounds to get an SD that i actually trust. The more data, the better.
For precision and long range shooting, under 10 is typically the standard. The higher the SD, the more vertical dispersion your shots will have at longer ranges. Since the amount of bullet drop is based on velocity, variations will give different points of impact at the same distance even with the exact same hold (not even accounting for rifle accuracy and shooter variables).
To not overwhelm this post, I will do another one soon on using average velocity, SD, rifle accuracy, target size, and distance, to calculate hit probability. This helps us know when we can confidently take shots and evaluate our max effective shooting distance. I am also planning on getting out shooting soon and doing a large shot string so we can visualize this with a real world situation.


Leave a comment